
Betfred
Five years running Betfred's digital product: research and personas from real data, a full redesign and Sitecore personalisation, 250 experiments a year, and 100 percent year-on-year growth for five consecutive years.
Duration
5 years
Team
75+
Scale
Enterprise
Scope
United Kingdom
Overview
Betfred is the world's largest independent bookmaker. In 2010 its digital business was losing money in a market where competitors had a decade's head start, and the site was static, dated and the same for everyone. I joined as Director of Operations, Product and UX Strategy and stayed five years, owning the customer-facing product end to end: digital product, UX, content, CRM, acquisition, retention and customer service, with more than seventy people and a board that wanted to know every month whether the investment was working.
Research first
The first months were audits and research: a full site audit, competitive analysis, journey mapping of the routes from first visit to first deposit, and a personas programme built from what the business already knew but had never joined up. Transactional data, demographic data and behavioural tracking were modelled together, so a persona was not a poster but a definition the platform could act on. James, the sports bettor, and the profiles beside him drove what the homepage showed each visitor. The real-time monitoring and profile analysis screens on this page are what the team ran the business from every morning.
The redesign
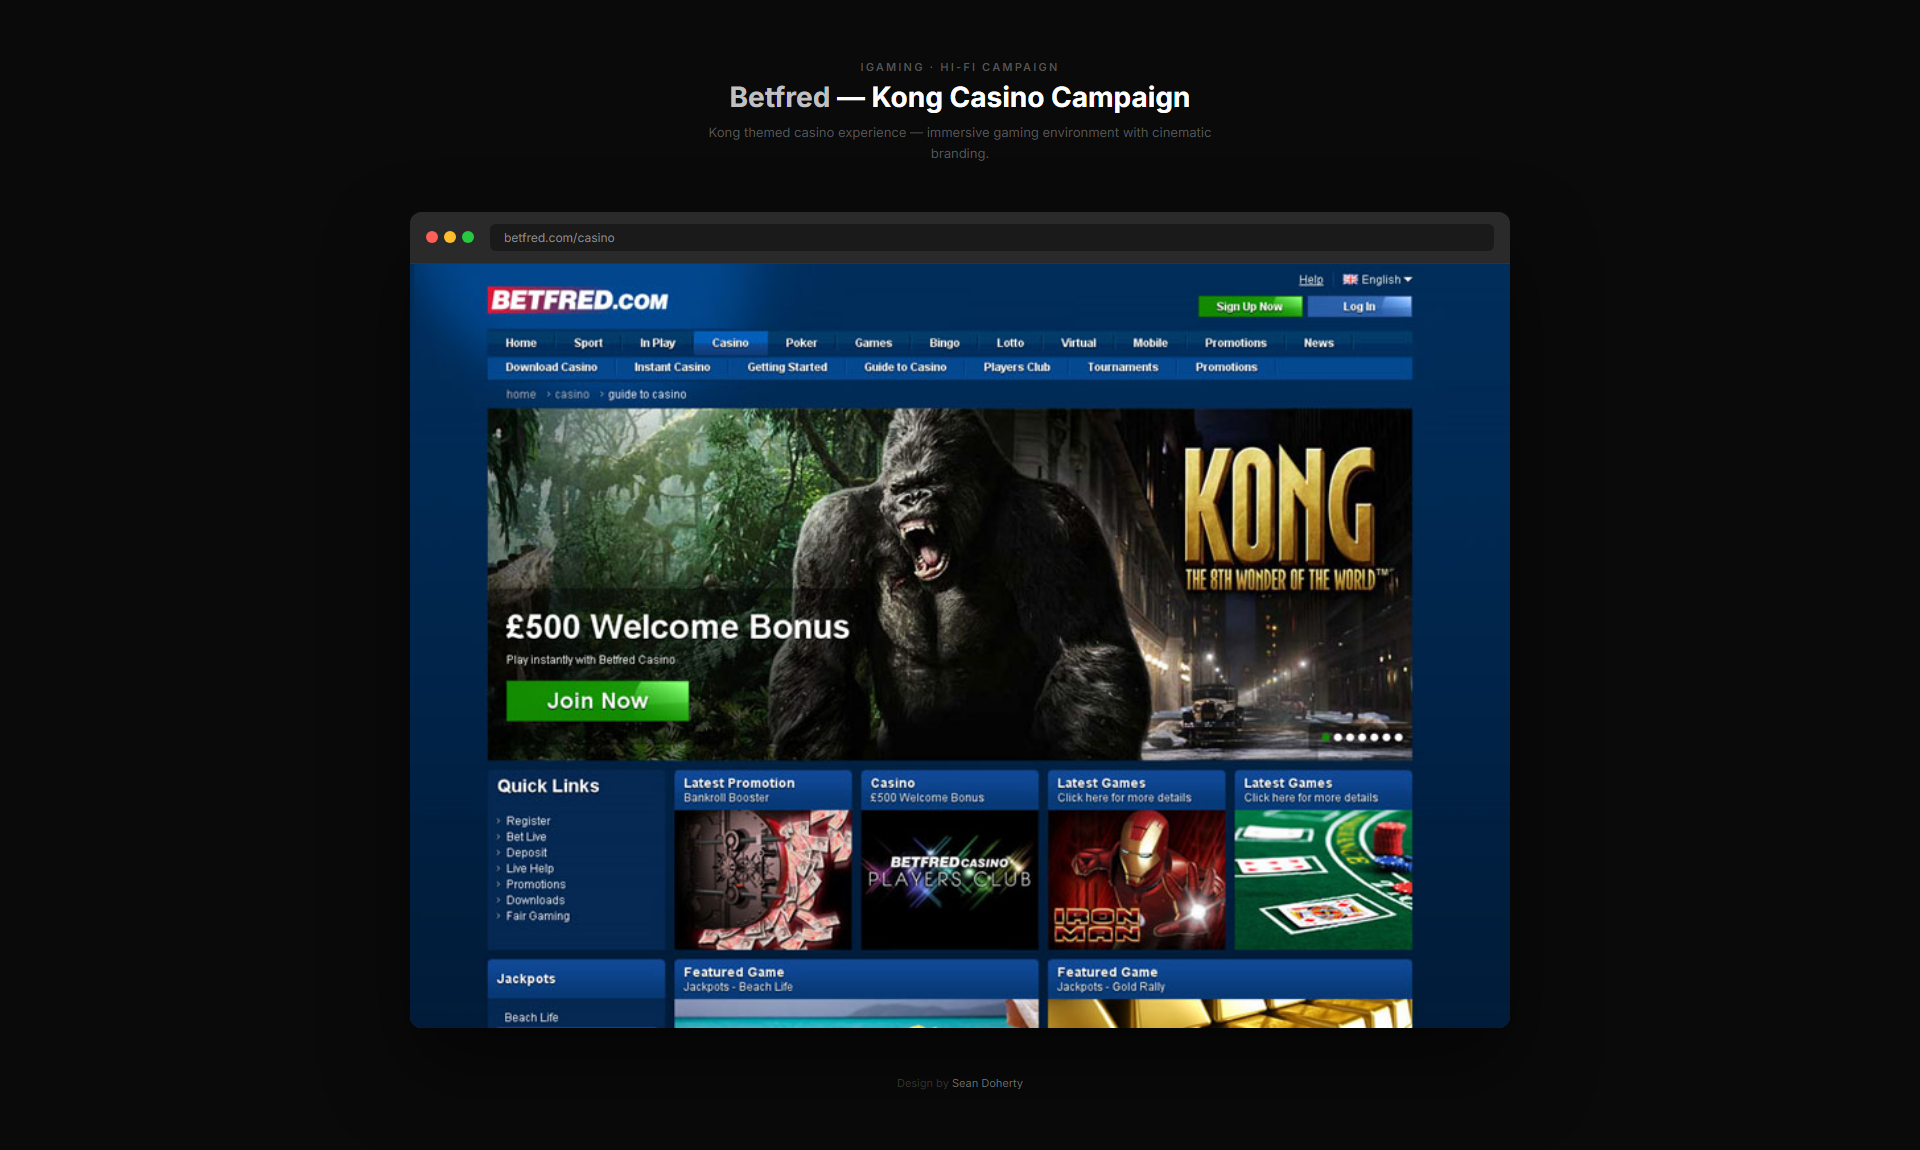
A new information architecture and a full redesign, from the annotated wireframe templates of November 2010 shown here through to the Sitecore implementation that carried the personalisation. The homepage became a set of states rather than a page: profile-based messaging and offerings for a known customer, the welcome bonus for a new one, favourite games for a casino player, and campaign takeovers for the big sporting events. Mobile followed, with an internal mobile development team built for it; by mid 2012 roughly forty percent of sports stakes were placed on a phone.
Build, measure, learn
Once the platform was live the work became a cadence: more than 250 build, measure, learn initiatives a year, each one an A/B test or a segmented release with a hypothesis and a number to move, and more than 30,000 content updates a year around them. Operational dashboards turned analytics into the day's decisions, and OKRs tied the team's work to revenue, satisfaction and lifetime value rather than to output. The Euro 2012 microsite drew more than 260,000 visits with a 25 percent click-through on its bet now calls to action; that was one initiative among the two hundred and fifty that year.
Results
Betfred Digital went from loss-making to 100 percent year-on-year revenue growth for five consecutive years. Customer satisfaction ran above 98 percent. Customer lifetime value rose 60 percent. New user traffic rose 70 percent in the first month after relaunch. The site won industry recognition for UX, UI and visual design, and accessibility to WCAG 2.0 AA was built into the deliverables from the outset.
Why it matters
The lesson from five years was that personalisation is an operating rhythm, not a feature. The personas, the dashboards and the experiment cadence are the same three things I have brought to every high-volume product since.
Project Artifacts
Project Details
Industry
iGaming
Duration
5 years
Team Size
75+
Direct Reports
5
Scale
Enterprise
Scope
United Kingdom
Budget
1M+
Platforms
Retail, Web, Mobile and Native: iOS and Android
Regulatory
Heavy
Engagement
End-to-End Product management, Design, development and ongoing support